|
|
|
[Sponsors] | ||||
 December 28, 2011, 22:02
|
|
#1 |
|
New Member
Akbar
Join Date: Dec 2011
Posts: 2
Rep Power: 0  |
excuse... my name is akbar.. im a college student in Sepuluh Nopember Institute of Technology... now i work for my final task using numeca and have a problem about visualize pressure using cfview... is there anybody here know how to visualize pressure using cfview... thanks before and sorry coz my english is bad..

|
|

|

|
|
|
December 29, 2011, 19:20
|
|
#2 |
|
Member
CJ
Join Date: Apr 2010
Location: Malaysia
Posts: 69
Rep Power: 16   |
Hi,
If you plan to see the pressure at your solid surface, just select the related surfaces from the top of QAP and next either select static or total pressure in the second column of QAP. Lastly, select the type of representation in the last column of QAP to view the results (using contour of course). You may create cutting plane in this case to see the pressure variation along the specific plane.
__________________
Regards CJ NUMIT Enterprise, Malaysia +6 017 656 3436 http://maccom-numit.blogspot.com http://www.numit.com.my Email : seiko.q@numit.com.my |
|
|
|
|
|
|
December 30, 2011, 03:15
|
|
#3 | |
|
New Member
Akbar
Join Date: Dec 2011
Posts: 2
Rep Power: 0 |
Quote:
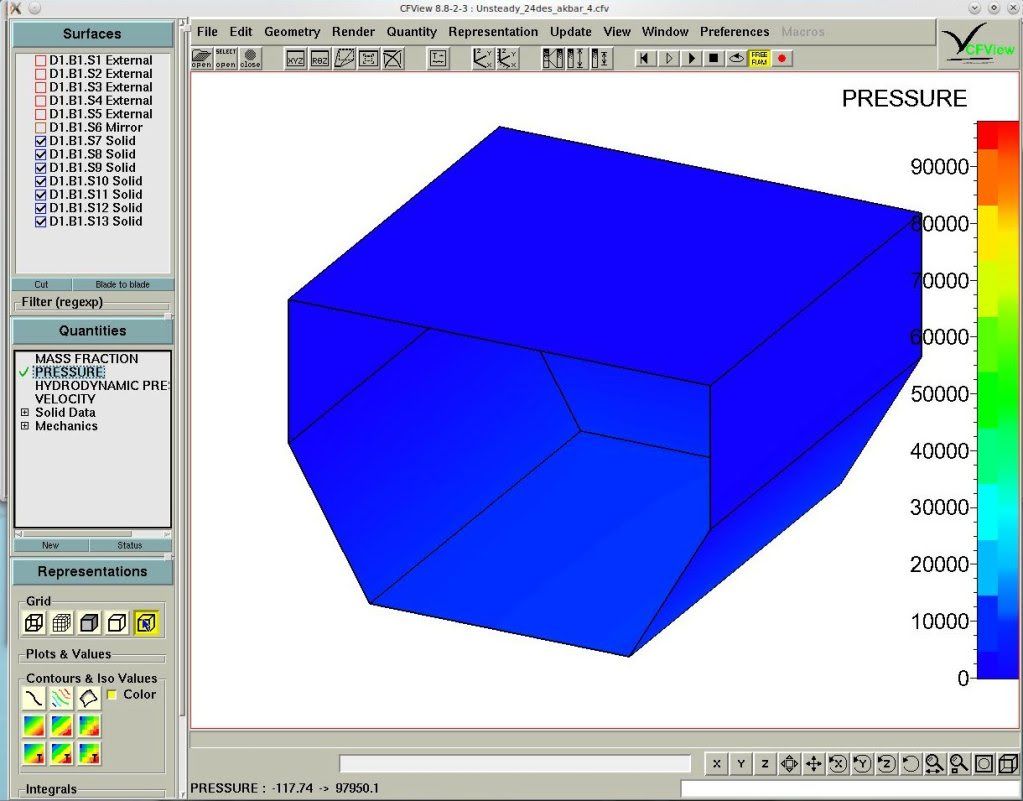
i already do that step, but there something strange with the pressure distribution n my model... all of their color is blue, no red or the other.... maybe there is something wrong but i really dont know... here is the picture...
pressure picture
best regard akbar |
||
|
|
|
||
|
January 13, 2012, 21:49
|
|
#4 |
|
Member
CJ
Join Date: Apr 2010
Location: Malaysia
Posts: 69
Rep Power: 16 |
Hi Akbar,
Sorry for keeping you to wait so long. You could use the colormap optimum range to plot your color. Please refer to your email.
__________________
Regards CJ NUMIT Enterprise, Malaysia +6 017 656 3436 http://maccom-numit.blogspot.com http://www.numit.com.my Email : seiko.q@numit.com.my |
|
|
|
|
|
 |
|
|
 Similar Threads
|
||||
| Thread | Thread Starter | Forum | Replies | Last Post |
| Pressure instabilities with interDyMFoam for the floatingObject case | nbadano | OpenFOAM Running, Solving & CFD | 15 | October 15, 2021 06:35 |
| Calculation of the Governing Equations | Mihail | CFX | 7 | September 7, 2014 06:27 |
| Using pressure outlet BC | Shreyansh | FLUENT | 0 | November 5, 2010 14:57 |
| Help ASAP! pressure inlet & outlet | engahmed | FLUENT | 0 | June 13, 2010 15:33 |
| Setting pressure and velocity in inlet | Asghari | FLUENT | 5 | September 22, 2006 13:23 |
 1Likes

 Linear Mode


