Dark side of Amdahl's law
Looking the latest HPCSource I came across very well-known picture, illustrating the Amdahl's law:

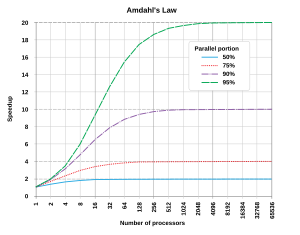
which shows the dependence of the speedup parallel code on number of processor cores for different fraction of time ( ) spent in the part that was not parallelized. This diagram is interested in me for the reason that just before I did test the scalability of one of my old 2D research parallel solvers.
We call it the T-DEEPS2D (Transient, Density based Explicit Effective Parallel Solver for 2D compressible NS). For the test used the problem of simulating Von Karman vortex street near the 2D cylinder on a uniform mesh 500x500 nodes.

This solver uses various types of balances of 1D domain decomposition with halo exchanges. The measurements were performed on two clusters with different numbers of nodes, different types of processors. The exec code was produced by same compiler (Intel C++ 10.1) but for different processors. Solver using non-blocking MPI calls (there are also versions of the solver with blocking MPI calls and OpenMP version, but more on that later). In both clusters for interconnect using Infiniband. So, my attention was attracted by speedup figures in the graphs. According to my tests turned out that my parallel solver code for 100 cores much better than 95%. I just took the formula of the Amdahl's law and knowing real acceleration and the number of cores was built a dependence of on the number of cores. See results below:


It turns out that is not constant but depends on the number of used cores/subdomains ... and tends to zero
Likely for other solvers picture might be different.
Who has any ideas on this case ?
which shows the dependence of the speedup parallel code on number of processor cores for different fraction of time (
) spent in the part that was not parallelized. This diagram is interested in me for the reason that just before I did test the scalability of one of my old 2D research parallel solvers.We call it the T-DEEPS2D (Transient, Density based Explicit Effective Parallel Solver for 2D compressible NS). For the test used the problem of simulating Von Karman vortex street near the 2D cylinder on a uniform mesh 500x500 nodes.
This solver uses various types of balances of 1D domain decomposition with halo exchanges. The measurements were performed on two clusters with different numbers of nodes, different types of processors. The exec code was produced by same compiler (Intel C++ 10.1) but for different processors. Solver using non-blocking MPI calls (there are also versions of the solver with blocking MPI calls and OpenMP version, but more on that later). In both clusters for interconnect using Infiniband. So, my attention was attracted by speedup figures in the graphs. According to my tests turned out that my parallel solver code for 100 cores much better than 95%. I just took the formula of the Amdahl's law and knowing real acceleration and the number of cores was built a dependence of
on the number of cores. See results below:It turns out that
is not constant but depends on the number of used cores/subdomains ... and tends to zeroLikely for other solvers picture might be different.
Who has any ideas on this case ?


Total Comments 2
Comments
-

 Hi, newbie here, why SDR shows better than DDR in your results?Posted March 28, 2012 at 09:20 by lakeat

-
 This is due to the fact that the one cluster was used Infiniband DDR and has nodes on NUMA architecture and a smaller cache (Opteron 285) against the other cluster which used SDR on the SMP (Xeon) and large cache.
The addition for each node we has two data exchanges (except first and last node) on Infiniband and 3 exchanges of internal memory (SMP or NUMA).
PS: If I use one process per node (exchange only for InfiniBand) that scalability will be even better, it's a paradox but a factPosted March 28, 2012 at 10:20 by SergeAS

