|
|
|
[Sponsors] | ||||
 April 13, 2015, 10:06
|
|
#1 |
|
Member
Join Date: Apr 2015
Posts: 41
Rep Power: 11  |
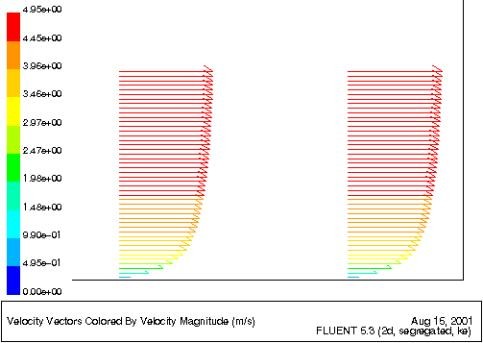
How can i get velocity profile on a flat plate with FLUENT like this ?
|
|

|

|
|
|
April 13, 2015, 10:43
|
|
#2 |
|
Senior Member
Cees Haringa
Join Date: May 2013
Location: Delft
Posts: 607
Rep Power: 0 |
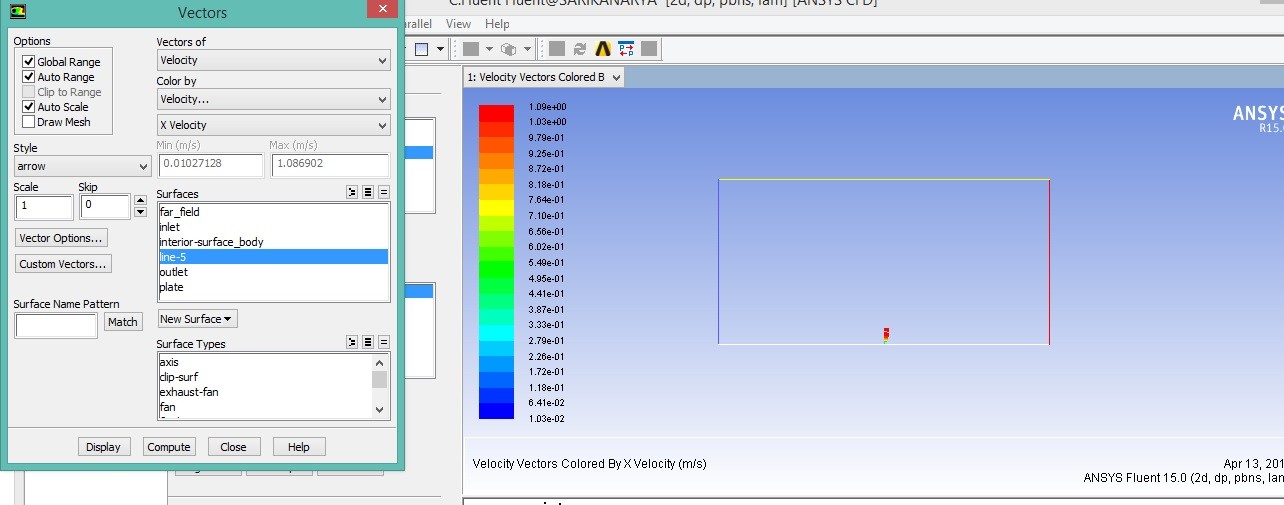
LIke mentioned before, set up lines normal to the surface at the locations you want to plot, and plot the x-velocity vectors on those lines
 Cheers, Cees |
|
|
|
|
|
|
April 13, 2015, 10:50
|
|
#3 | |
|
Member
Join Date: Apr 2015
Posts: 41
Rep Power: 11 |
Quote:
|
||
|
|
|
||
|
April 13, 2015, 10:58
|
|
#4 |
|
Senior Member
Cees Haringa
Join Date: May 2013
Location: Delft
Posts: 607
Rep Power: 0 |
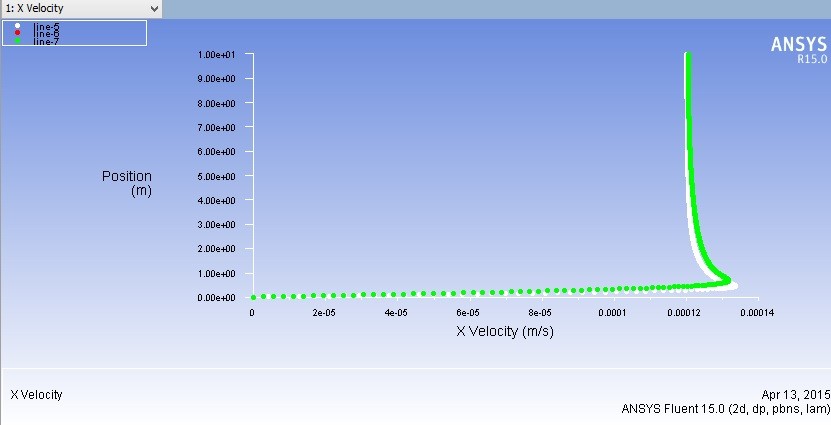
well, I wouldn't worry too much about the plot itself. more about your results; why is there a peak in your velocity profile? Discretization schemes maybe?
Regarding the plot, you apperantly want a vector plot rather than an x-y plot. That can be done. Use graphics and animations > vectors rather than reports > plot. Think about the length of your line too, because you now plot a large part of the bulk which compresses the boundary layer. Doesn't mean the plot is wrong, but it compromises clarity. |
|
|
|
|
|
|
April 13, 2015, 11:07
|
|
#5 | |
|
Member
Join Date: Apr 2015
Posts: 41
Rep Power: 11 |
Quote:
|
||
|
|
|
||
|
April 13, 2015, 11:09
|
|
#6 |
|
Senior Member
Cees Haringa
Join Date: May 2013
Location: Delft
Posts: 607
Rep Power: 0 |
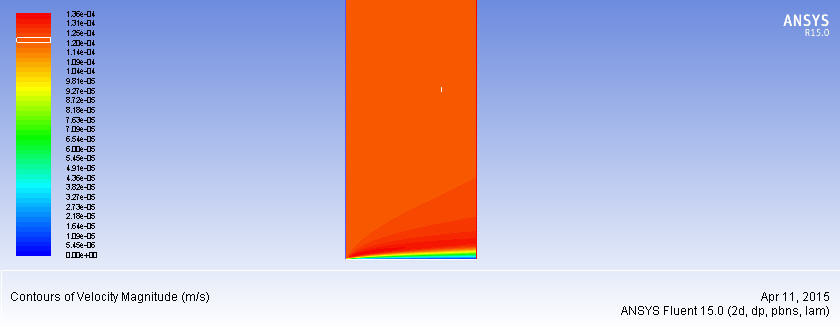
that's a contour plot. Not a vector plot. Also, this is on the whole body, not just on the lines you made.
|
|
|
|
|
|
|
April 13, 2015, 11:11
|
|
#7 | |
|
Member
Join Date: Apr 2015
Posts: 41
Rep Power: 11 |
Quote:
|
||
|
|
|
||
|
April 13, 2015, 11:13
|
|
#8 |
|
Senior Member
Cees Haringa
Join Date: May 2013
Location: Delft
Posts: 607
Rep Power: 0 |
graphics and animations menu, option 3 is 'vectors'. Click this one, and select the created lines as plot regions
|
|
|
|
|
|
|
April 13, 2015, 11:19
|
|
#9 | |
|
Member
Join Date: Apr 2015
Posts: 41
Rep Power: 11 |
Quote:
|
||
|
|
|
||
|
April 13, 2015, 11:21
|
|
#10 |
|
Senior Member
Cees Haringa
Join Date: May 2013
Location: Delft
Posts: 607
Rep Power: 0 |
You can't zoom in. What you can do is make new lines, which have a short y-component - close to what you expect the boundary layers to be.
Edit: sorry, of course you can zoom in using the zoom tool in the top menu. My bad. |
|
|
|
|
|
|
April 13, 2015, 11:31
|
|
#11 | |
|
Member
Join Date: Apr 2015
Posts: 41
Rep Power: 11 |
Quote:
 and someone got it and someone got it  why ? why ?
|
||
|
|
|
||
|
April 13, 2015, 11:35
|
|
#12 |
|
Senior Member
Cees Haringa
Join Date: May 2013
Location: Delft
Posts: 607
Rep Power: 0 |
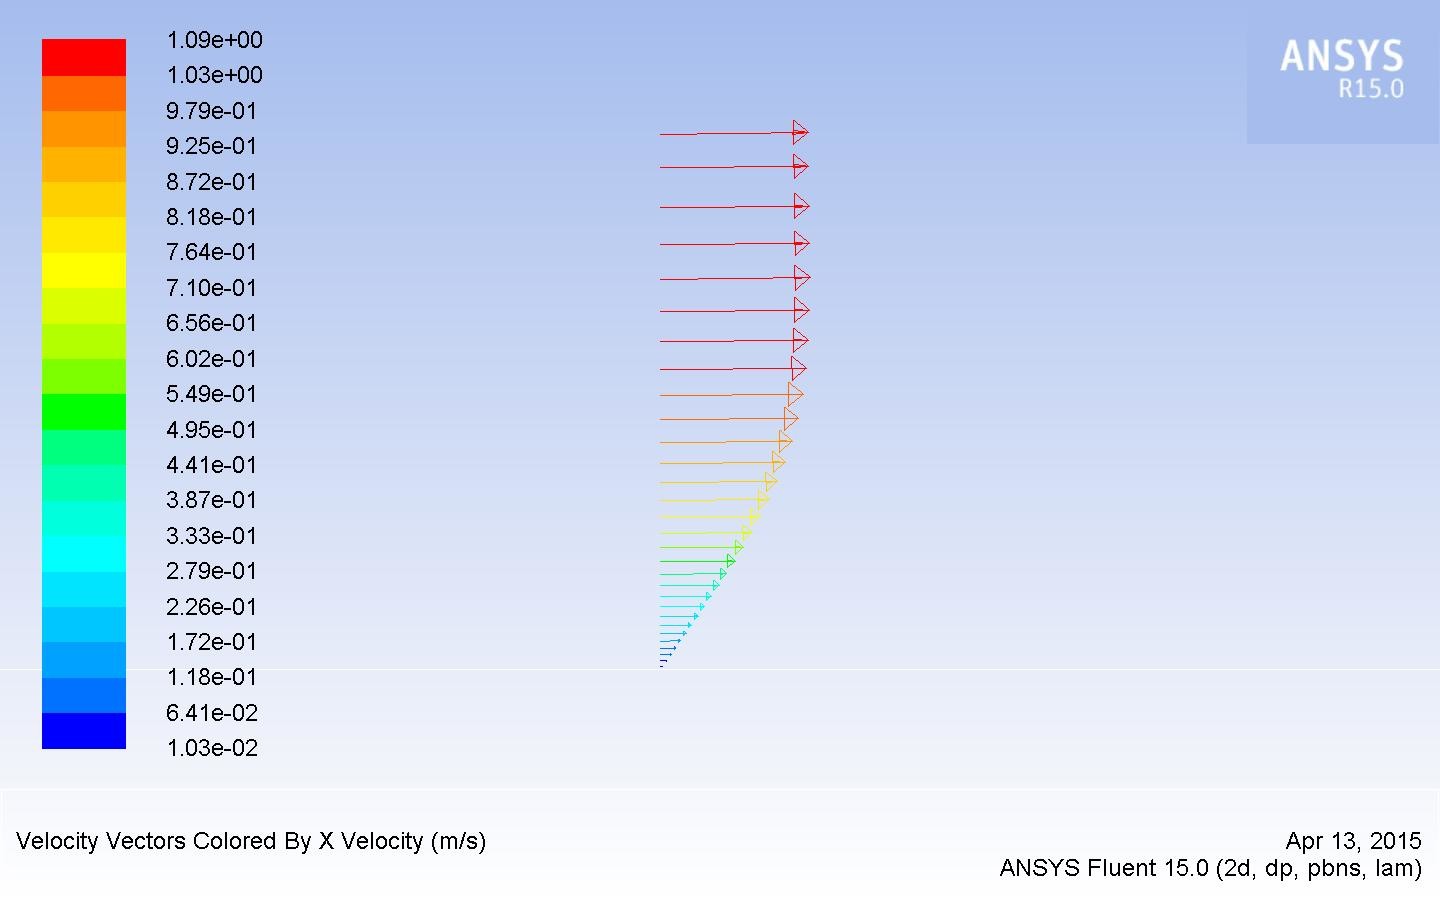
because you are plotting over the whole domain height. You need to make a line that doesn't extend all the way from top to bottom, but instead only to say, Y = 2D where D is the estimated boundary layer thickness.
|
|
|
|
|
|
|
April 13, 2015, 11:41
|
|
#13 | |
|
Member
Join Date: Apr 2015
Posts: 41
Rep Power: 11 |
Quote:
|
||
|
|
|
||
|
April 13, 2015, 11:43
|
|
#14 |
|
Senior Member
Cees Haringa
Join Date: May 2013
Location: Delft
Posts: 607
Rep Power: 0 |
make a new line/rake, and enter the x and y coordinates you want.
for x, maybe you want L/2 again? for y, take 0 to some that is more in line with the size of the boundary layer. Maybe something like H/10, where H is the total height in the y-direction |
|
|
|
|
|
|
April 13, 2015, 11:50
|
|
#15 | |
|
Member
Join Date: Apr 2015
Posts: 41
Rep Power: 11 |
Quote:
 ... ...Why couldn't i get this again ? 
|
||
|
|
|
||
|
April 13, 2015, 11:54
|
|
#16 |
|
Senior Member
Cees Haringa
Join Date: May 2013
Location: Delft
Posts: 607
Rep Power: 0 |
If you use the + button on the screen now to zoom your view?
click on the zoom icon, and draw a box around the profile you made. (sorry, when I said 'you can't zoom' before, I meant you cannot plot only the boundary layer piece. of course you can still zoom the view; my mistake) |
|
|
|
|
|
|
April 13, 2015, 11:59
|
|
#17 | |
|
Member
Join Date: Apr 2015
Posts: 41
Rep Power: 11 |
Quote:
|
||
|
|
|
||
|
April 13, 2015, 12:16
|
|
#18 |
|
Senior Member
Cees Haringa
Join Date: May 2013
Location: Delft
Posts: 607
Rep Power: 0 |
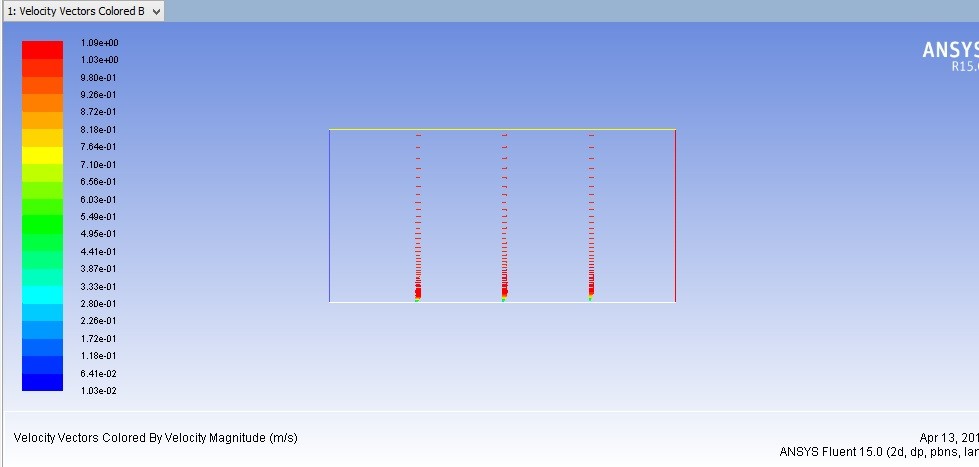
Unfortunately, that's not a plotting question. It seems there is a y-component in your velocity as well (of course, you can check this) - and the vector direction is based on the velocity direction. This also causes a local maximum at the edge of your boundary layer. So there seems to be an error in your simulation. Do you use laminar or turbulent flow (and what is your reynolds number?) Did the simulation converge? Which momentum discretization scheme did you use?
|
|
|
|
|
|
|
April 13, 2015, 12:22
|
|
#19 | |
|
Member
Join Date: Apr 2015
Posts: 41
Rep Power: 11 |
Quote:
|
||
|
|
|
||
|
April 13, 2015, 12:30
|
|
#20 |
|
Senior Member
Cees Haringa
Join Date: May 2013
Location: Delft
Posts: 607
Rep Power: 0 |
I just looked at the Cornell results, and they do see the same overshoot in velocity at the edge of the boundary layer there. With that, I assume there is a small y-velocity component as well. Because in your case, it is there in the solution. If you color by the y-velocity instead of x-velocity, you'll see.
|
|
|
|
|
|
 |
|
|
 Similar Threads
|
||||
| Thread | Thread Starter | Forum | Replies | Last Post |
| [UDF] Relative coordinates in logarithmic velocity profile | cfdworker | Fluent UDF and Scheme Programming | 25 | July 13, 2017 03:44 |
| [swak4Foam] Inlet velocity profile for turbulent pipe flow using swak4Foam | zordiack | OpenFOAM Community Contributions | 5 | February 23, 2016 01:52 |
| Logarithmic velocity profile | cfdworker | Fluent UDF and Scheme Programming | 0 | April 23, 2009 19:09 |
| [boundary condition] logarithmic velocity profile | cfdworker | FLUENT | 2 | April 17, 2009 23:36 |
| Prescribed inflow velocity profile - how to? | Alan | Main CFD Forum | 10 | October 28, 2005 12:14 |
 15Likes
 Linear Mode


