|
|
|
[Sponsors] | ||||
 January 9, 2012, 06:57
|
|
#1 |
|
New Member
Join Date: Jan 2012
Posts: 5
Rep Power: 14  |
Hi guys,
If I am modelling a pipe with a constant inflow rate, how am I able to get the outlet velocity profile, down the center of the pipe. I assumed I could create a plane section in the middle but am unsure how to plot the outlet velocity. Also how is it possible to set the stopping criteria to when the velocity profile is constant? Should a Steady flow model be the best method to use. Any help would be much appreciated. The graph should look like the one below. 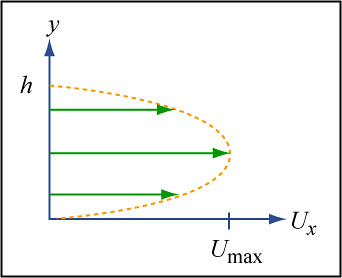 Many thanks Amish |
|

|

|
|
|
January 10, 2012, 00:37
|
|
#2 |
|
Member
aerosapien
Join Date: Sep 2010
Posts: 59
Rep Power: 15 |
create a section along the center of the pipe line, you get the vector and scalar plots!!!
|
|
|
|
|
|
|
January 10, 2012, 03:48
|
|
#3 |
|
Senior Member
Ping
Join Date: Mar 2009
Posts: 556
Rep Power: 20 |
to get a plot rather than a scene, create a section plane through the central axis, but use the outlet boundary as the input part, rather than the fluid region - this new derived part is then a line rather than a plane.
then create a plot with this section 'line' as the input part, Y (0,1,0) as the x axis (the plot will be rotated of course), and some field function as the y axis - eg velocity magnitude. for a stopping criteria, you could probably do something with a new Field Variance Monitor using the line part as its part, then a report and monitor of this, then a stopping criteria on this monitor (and maybe others too). |
|
|
|
|
|
|
January 10, 2012, 05:10
|
|
#4 |
|
Member
Join Date: Feb 2011
Location: DE-PB
Posts: 56
Rep Power: 15 |
Additionally to pings good advice you can also use an line probe as derived part for your XY-plot.
|
|
|
|
|
|
|
January 18, 2012, 10:24
|
|
#5 |
|
New Member
Join Date: Jan 2012
Posts: 5
Rep Power: 14 |
Ping,
Thank you very much for your help. I managed to get a plot witch looked somewhat correct. Like you said, it needs to be rotated, but that's a minor issue. Creating the plane section along the output, and plotting the graph, gives me a weird result. But using a line section as willimanili suggested gave better results. Thanks again guys 
|
|
|
|
|
|
 |
|
|
 Similar Threads
|
||||
| Thread | Thread Starter | Forum | Replies | Last Post |
| [UDF] Relative coordinates in logarithmic velocity profile | cfdworker | Fluent UDF and Scheme Programming | 25 | July 13, 2017 03:44 |
| Logarithmic velocity profile | cfdworker | Fluent UDF and Scheme Programming | 0 | April 23, 2009 19:09 |
| [boundary condition] logarithmic velocity profile | cfdworker | FLUENT | 2 | April 17, 2009 23:36 |
| Prescribed inflow velocity profile - how to? | Alan | Main CFD Forum | 10 | October 28, 2005 12:14 |
| Terrible Mistake In Fluid Dynamics History | Abhi | Main CFD Forum | 12 | July 8, 2002 09:11 |
 Linear Mode


