|
|
|
[Sponsors] | ||||
 July 20, 2020, 14:16
|
|
#1 |
|
New Member
Join Date: May 2020
Posts: 16
Rep Power: 6  |
I've read a few papers on airfoil and wing analysis and Cp plot of the wing recur a lot. What does the Cp plot signify--I know that it is the distribution of pressure over the airfoil.
1) If I have a Cp plot of an airfoil what all can I determine from it? 2) Can I determine where exactly the flow separates if I have the Cp plot? if "yes", how? 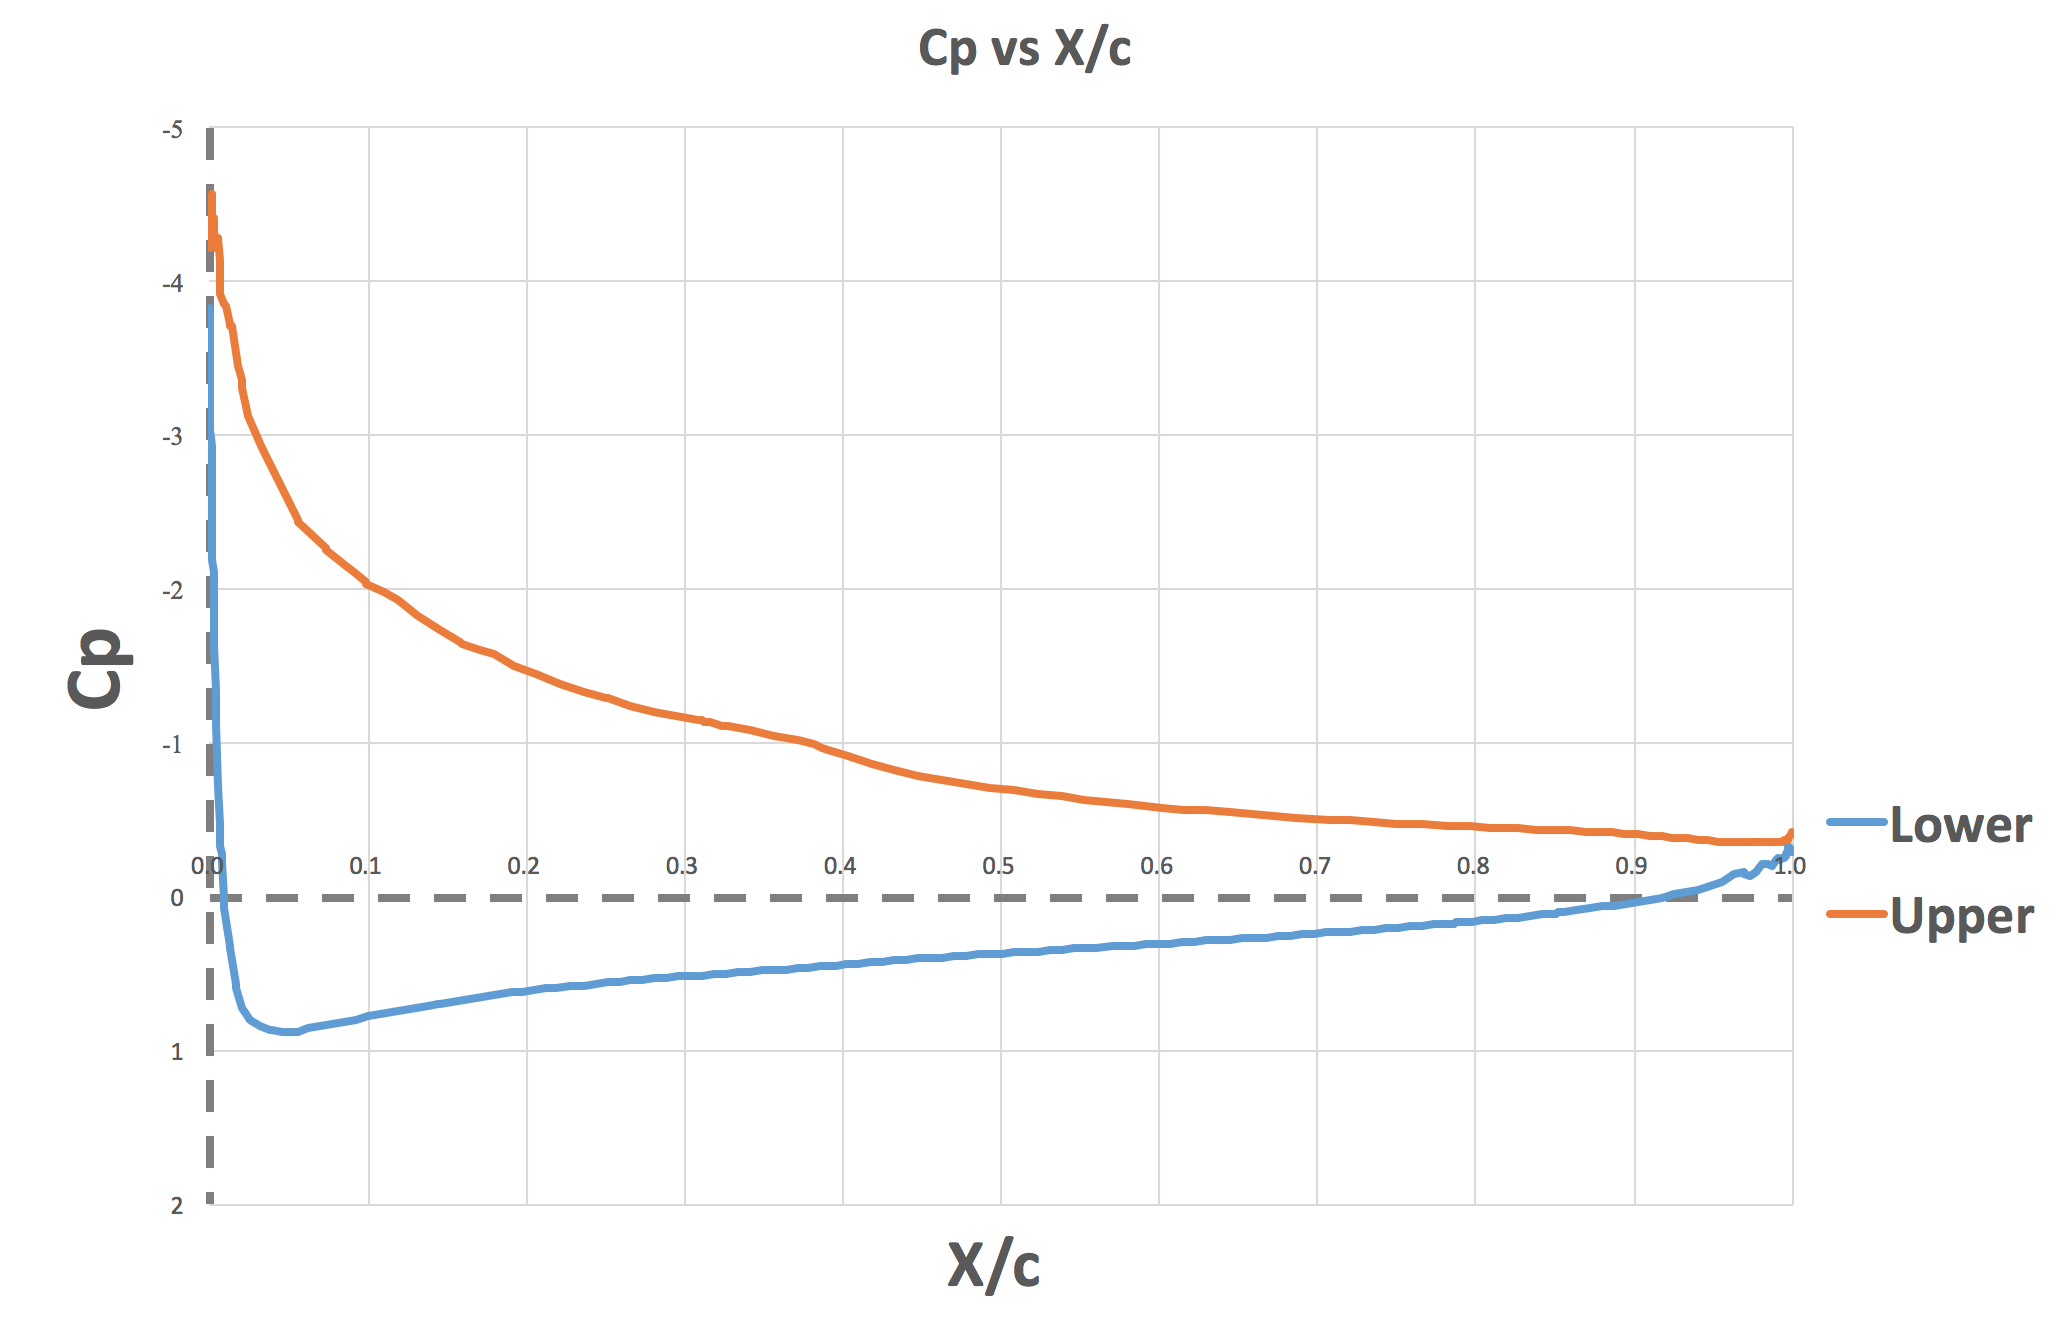
|
|

|

|
|
|
November 30, 2020, 02:29
|
|
#2 |
|
Senior Member
Kira
Join Date: Nov 2020
Location: Canada
Posts: 435
Rep Power: 8 |
Hello Nishanth,
1) We can plot Cp vs x/c to determine the pressure distribution on the airfoil as well as determine the centre of pressure. Determining the centre of pressure is very important for any flying object. To trim an airplane, or to provide stability for a model rocket or a kite, it is necessary to know the location of the center of pressure of the entire aircraft. In general, determining the center of pressure (cp) is a very complicated procedure because the pressure changes around the object. But by plotting this, it is easier to determine. 2) Separation occurs theoretically at the point where Cf is zero. So, if you have a Cf vs x/c graph, you can find this point easily. However, it is not so easy to find it from a Cp vs x/c graph. A separation may be expected normally after a minimum pressure point along a surface, but it is not certain, and if there is a separation you can not predict the separation point exactly from the Cp vs x/c graph, instead you must calculate the boundary layer and find the point where Cf is zero. You can divide the pressure distribution around a body such as an airfoil into two region beginning from the leading edge. In the first region near the leading edge the pressure begin with a maximum value at the stagnation point then decrease up to a minimum value, while the airflow velocity increase along the surface. This is the favorable pressure gradient region (dp/dx<0). There is no risk of separation in this region After a minimum point the pressure begin to increase along the surface, while the velocity decrease. This is the pressure recovery region, or unfavorable adverse-pressure gradient region (dp/dx>0). In this region there is a risk of separation if the pressure gradient is high enough. After a certain point on the cp(x) graph in this adverse pressure gradient region if there is a constant pressure region, this region may be an indication of separation. However this is not so clear. Therefore it is better to calculate the boundary layer on the surface, then evaluate if there is a point where Cf is near zero. |
|
|
|
|
|
 |
| Tags |
| airfoil 2d, cp plot |
| Thread Tools | Search this Thread |
| Display Modes | |
|
|
 Similar Threads
|
||||
| Thread | Thread Starter | Forum | Replies | Last Post |
| Ffd_control_point_2d | feiyi | SU2 | 4 | September 30, 2019 12:42 |
| [OpenFOAM] How to plot wall shear stress on airfoil in paraview? | 729084000 | ParaView | 1 | July 18, 2017 06:28 |
| [General] Plot Cp along airfoil NACA0012 | tardiflu | ParaView | 0 | May 16, 2017 10:58 |
| [OpenFOAM] how can plot velocity profile on an airfoil over a line? | s.m | ParaView | 6 | January 5, 2014 17:20 |
| [CFD-Post] Plot of pressure on an airfoil | Santos-Dumont | ANSYS | 2 | January 29, 2013 11:39 |
 1Likes


 Linear Mode


