|
|
|
[Sponsors] | ||||
Plot of Total Kinetic Energy with respect to time |
 |
|
|
LinkBack | Thread Tools | Search this Thread | Display Modes |
 October 20, 2020, 13:56
|
|
#1 |
|
New Member

Shivam gupta
Join Date: Jan 2020
Posts: 5
Rep Power: 6  |
Hello everyone,
I want to plot Total Kinetic Energy of the domain with respect to time in paraview to check whether my Simulation has achieved steady-state or not. I am not getting any suitable filters/options to do that. Can anybody help me with that? Using python calculator, I calculated the scalar field for kinetic energy but I am not getting how I can sum of all the K.E. of the domain as an individual variable and then plot it with respect to time. I am simulating the mixing of two microfluidics in a split and recombine mixer. 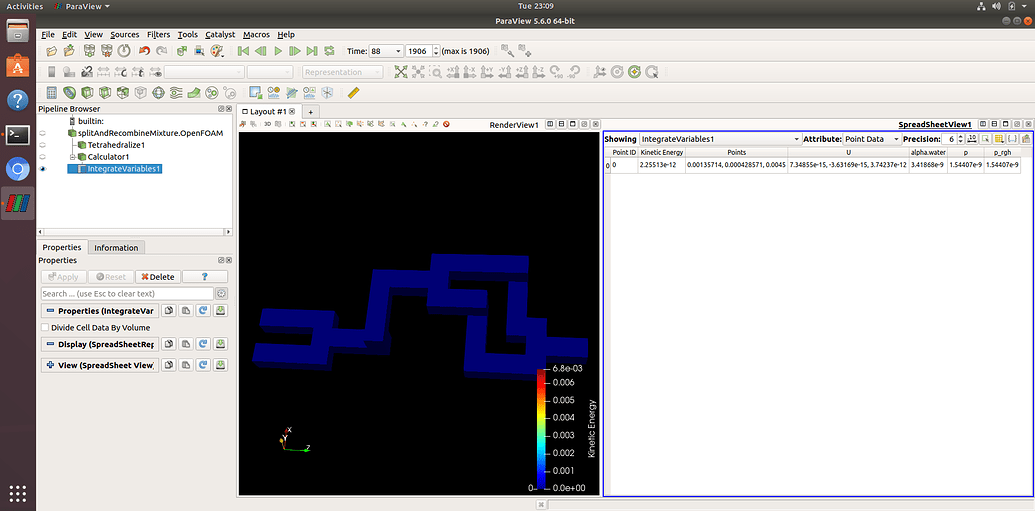
|
|

|

|
|
|
October 27, 2022, 22:26
|
|
#2 |
|
New Member
Join Date: Apr 2022
Posts: 3
Rep Power: 4 |
This may help you,besides you can also traverse the mesh through the pointer in the solver.
https://forum.cfdac.com/t/topic/802/2 |
|
|
|
|
|
|
|
|
 Similar Threads
|
||||
| Thread | Thread Starter | Forum | Replies | Last Post |
| [Other] Contribution a new utility: refine wall layer mesh based on yPlus field | lakeat | OpenFOAM Community Contributions | 58 | December 23, 2021 02:36 |
| Extrusion with OpenFoam problem No. Iterations 0 | Lord Kelvin | OpenFOAM Running, Solving & CFD | 8 | March 28, 2016 11:08 |
| Moving mesh | Niklas Wikstrom (Wikstrom) | OpenFOAM Running, Solving & CFD | 122 | June 15, 2014 06:20 |
| How to write k and epsilon before the abnormal end | xiuying | OpenFOAM Running, Solving & CFD | 8 | August 27, 2013 15:33 |
| plot over time | fferroni | OpenFOAM Post-Processing | 7 | June 8, 2012 07:56 |
 Linear Mode


